
Main process from introduction to delivery
At FRACTA, we value sharing information with our customers and provide plenty of opportunities for preliminary hearings and meetings.
By taking a step-by-step approach, we help solve industry-wide challenges while proving tailored solutions to meet your utility’s specific needs.

When we receive your inquiry regarding our services, a sales representative in your area will contact you immediately.
We will conduct repeated interviews with you to understand the issues your business is facing, and during our meetings, we will propose diagnostic methods that are appropriate to resolve the issues. Even before signing a contract, if there is anything you don’t understand, we will be happy to explain it to you as many times as you like.
We collect system data for input in our models.
- Pipeline data
- Water leakage history
Our Data Scientists clean the data and confirm we have all of the information we need.
Confirm all relevant data has been provided to FRACTA.
FRACTA’s team processes the data and generates an initial report and preliminary diagnosis.
If any changes are necessary or unclear results are found, FRACTA’s team corrects any anomalies and reprocesses the customer data.
Once the data has been fully prepared for final processing, the FRACTA team produces the final model for presentation to the customer.
The sales team and lead engineer present the final model and report to the customer in person, making sure they completely understand the results. Our team answer any questions and work with the client’s team until everyone is comfortable with FRACTA’s solution.
We will deliver the following contents as deliverables.
- Summary report
- Diagnosis result data csv, shp
- Online tool access rights, etc.
*If your business entity needs anything other than the above, please contact us.
Our team is always available to answer questions or conduct training.
- How to read the diagnosis results
- How to use online tools
- How to utilize the results, etc.
Contact FRACTA today!
Online tool function
Main features
- Filter function (water leakage risk level/year of installation/pipe type/diameter/past water leakage history)
- Backup function
- Map save function
- csv data output function
About accuracy and verification methods
We use a method called time-shift study to verify the model. Specifically, we divided the received water leakage data (e.g. 10 years from 2010-2020) into training data (2010-2018) and verification data (2018-2020), and utilized the learning data.
Build a model and predict deterioration.
We compare pipes that are predicted to have a high degree of deterioration with the above verification data, and conduct verification from the perspective of how much leakage that actually occurred was captured.
In addition to the above, we are also collating diagnostic results with pipe investigation results.
Screen image
Diagnosis results are categorized
by color
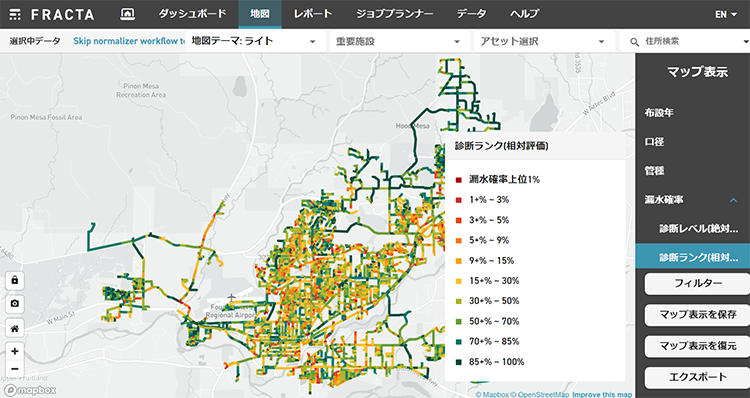
The predicted deterioration ranking is displayed by color.
Diagnosis results are displayed for each pipe line.
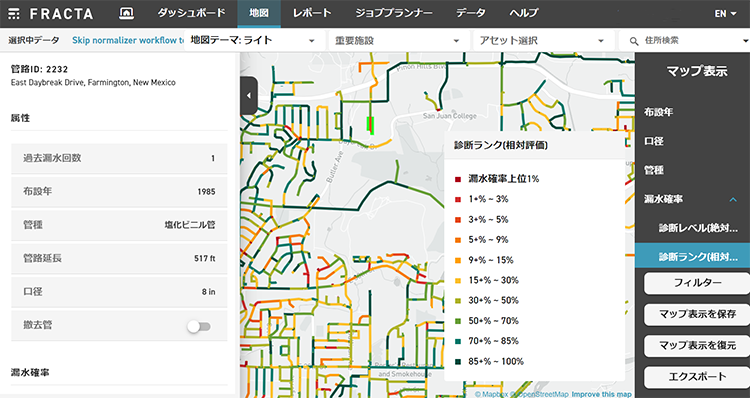
Click on a pipe to display more detailed information for each pipe ID.
Displays environmental factors that are considered important by AI
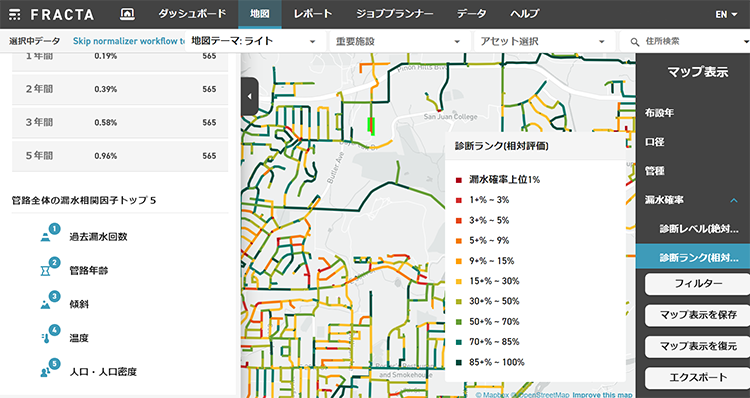
You can check the top 5 factors related to diagnosis
FAQ
- What data is required for diagnosis?
-
If you can provide basic pipe data (year of installation, pipe type, diameter, length, location information, etc.) and past leakage history (leak point, leak cause, year of installation, pipe type, diameter, etc.), You can use our deterioration prediction solution.
- What kind of follow-up is available?
-
Our specialized staff will be happy to assist you with how to use online tools.