Solutions
Fracta’s Likelihood of Failure model sits under everything we deliver: priority areas for leak crews, a risk score for every main, and the dollar figure behind each capital decision.
Find leaks now
Leak Zones
Probability
Likelihood of Failure
Consequence
Cost of Failure
Dollars at risk
Total Risk
One AI model underneath: 120+ variables, trained on 560,000+ recorded breaks.
Recognized & trusted
AWWA Innovation Award · 2022
Prime Minister’s Award, Japan · 2025
A Kurita Water Industries company
Trusted by over 100 utilities across North America
Fracta Leak Zones · Start here
Leak Zones ranks the areas of your network most likely to contain leaks, and the pipes inside each area most worth investigating. It starts with your pipe inventory and break history; a periodic SCADA export turns that risk into a leakage signal.
Priority area
Zone 2 of 4
Flagged for field investigation. Ranked pipes guide where crews check first.
Ranked pipes in this zone
Risk assessment
The same model that powers Leak Zones scores every pipe for how likely it is to fail and what that failure would cost, so your next capital dollar goes where it removes the most risk.
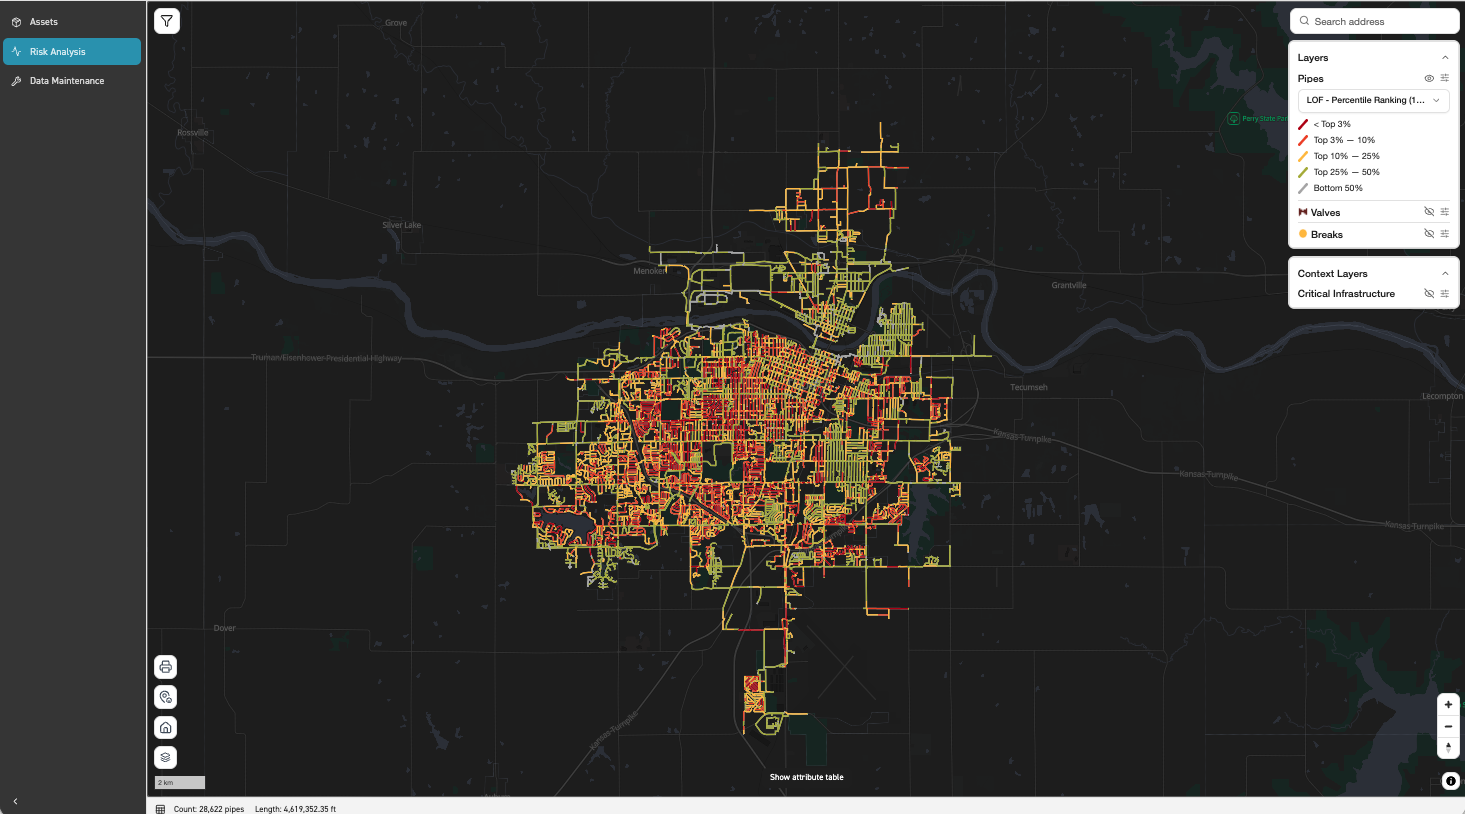
Likelihood of Failure
A probability of failure for every segment at 1, 2, 3 and 5 years, a percentile rank and the top five risk drivers.
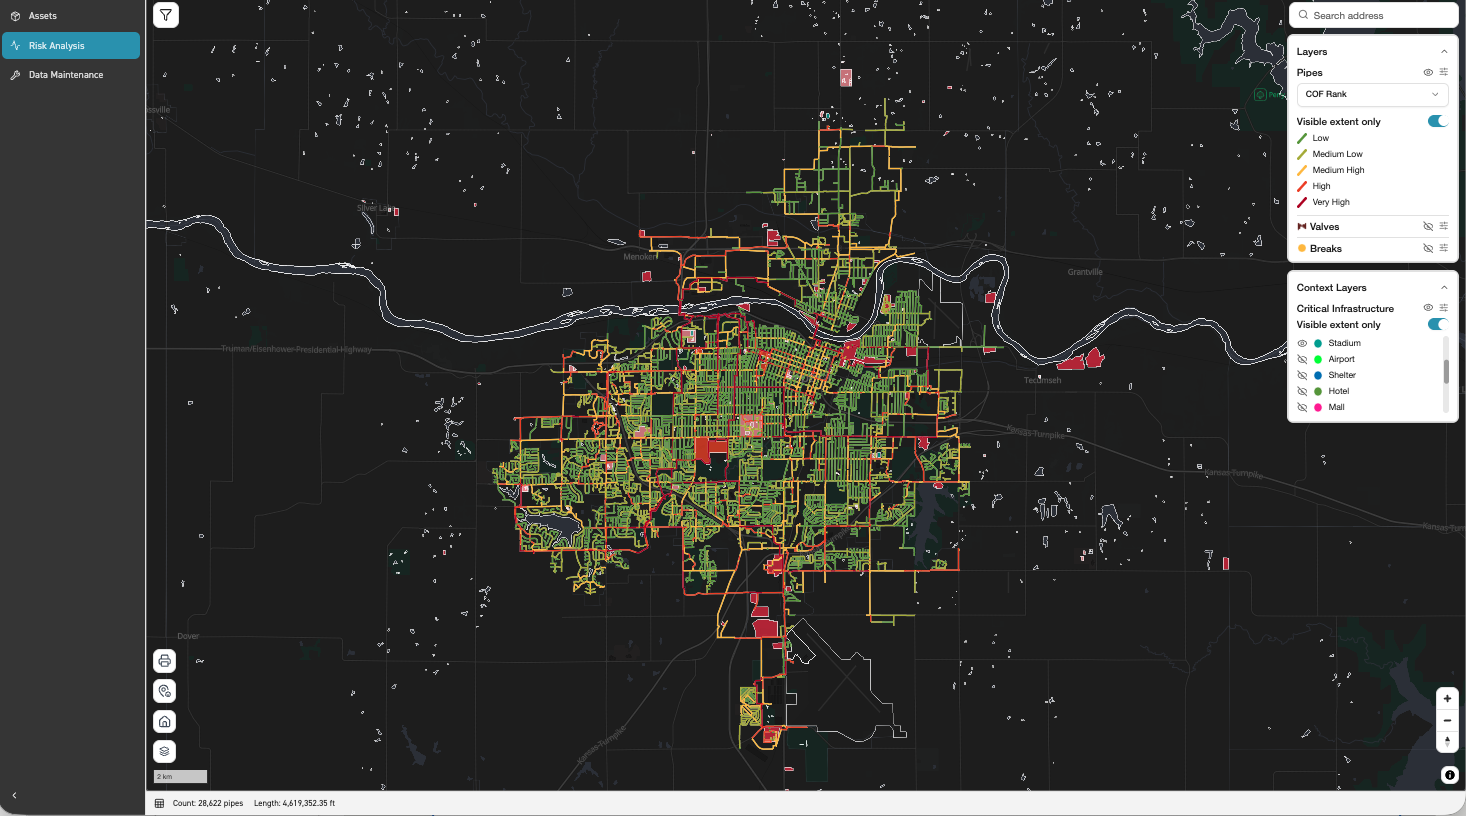
Cost of Failure
Direct and indirect cost on every segment, location-aware: a side street and an arterial outside a hospital are not the same event.
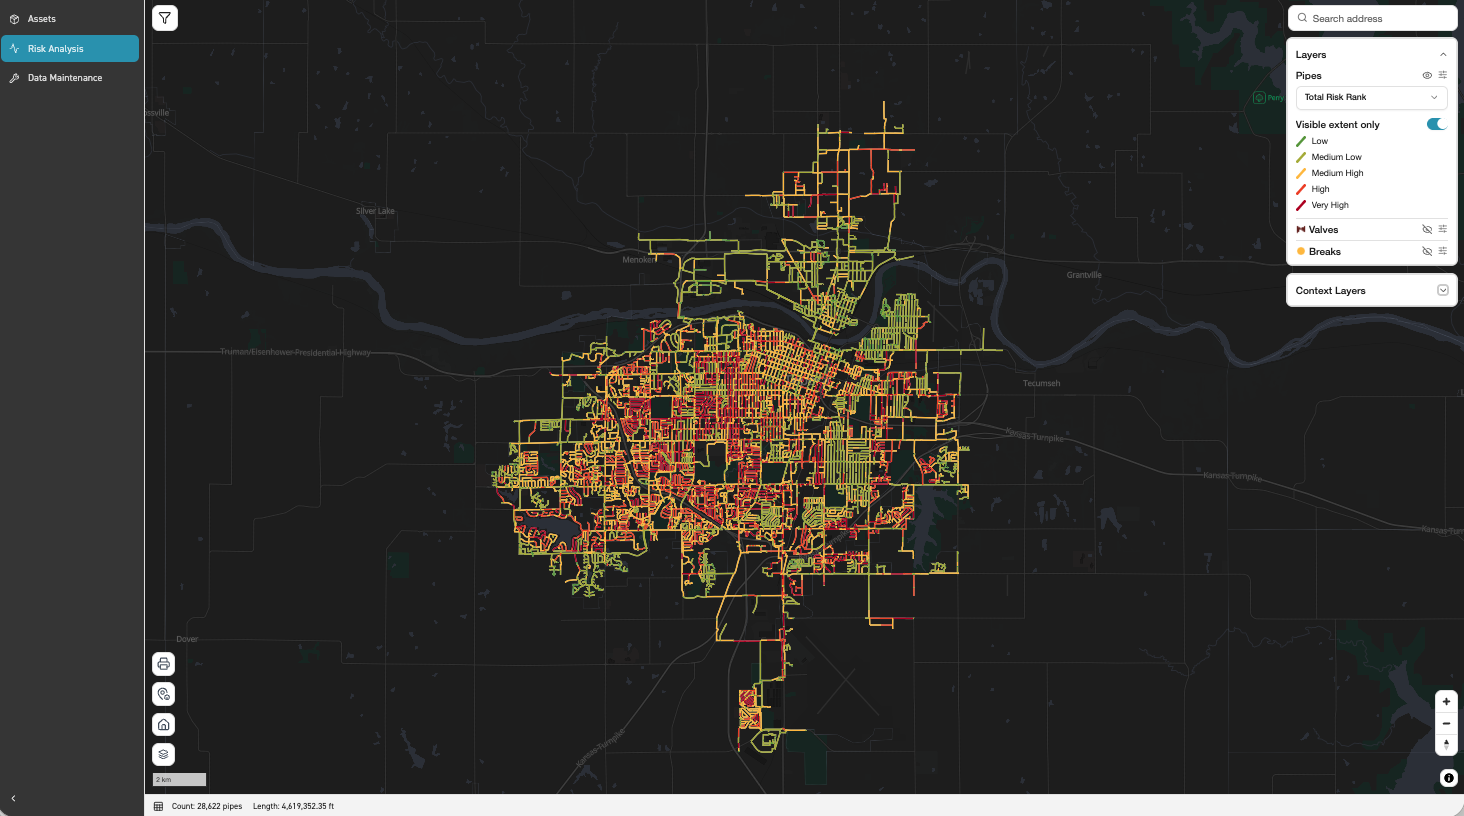
Total Risk
Likelihood multiplied by cost: one criticality score comparable across the system, and a clear answer on where capital goes.
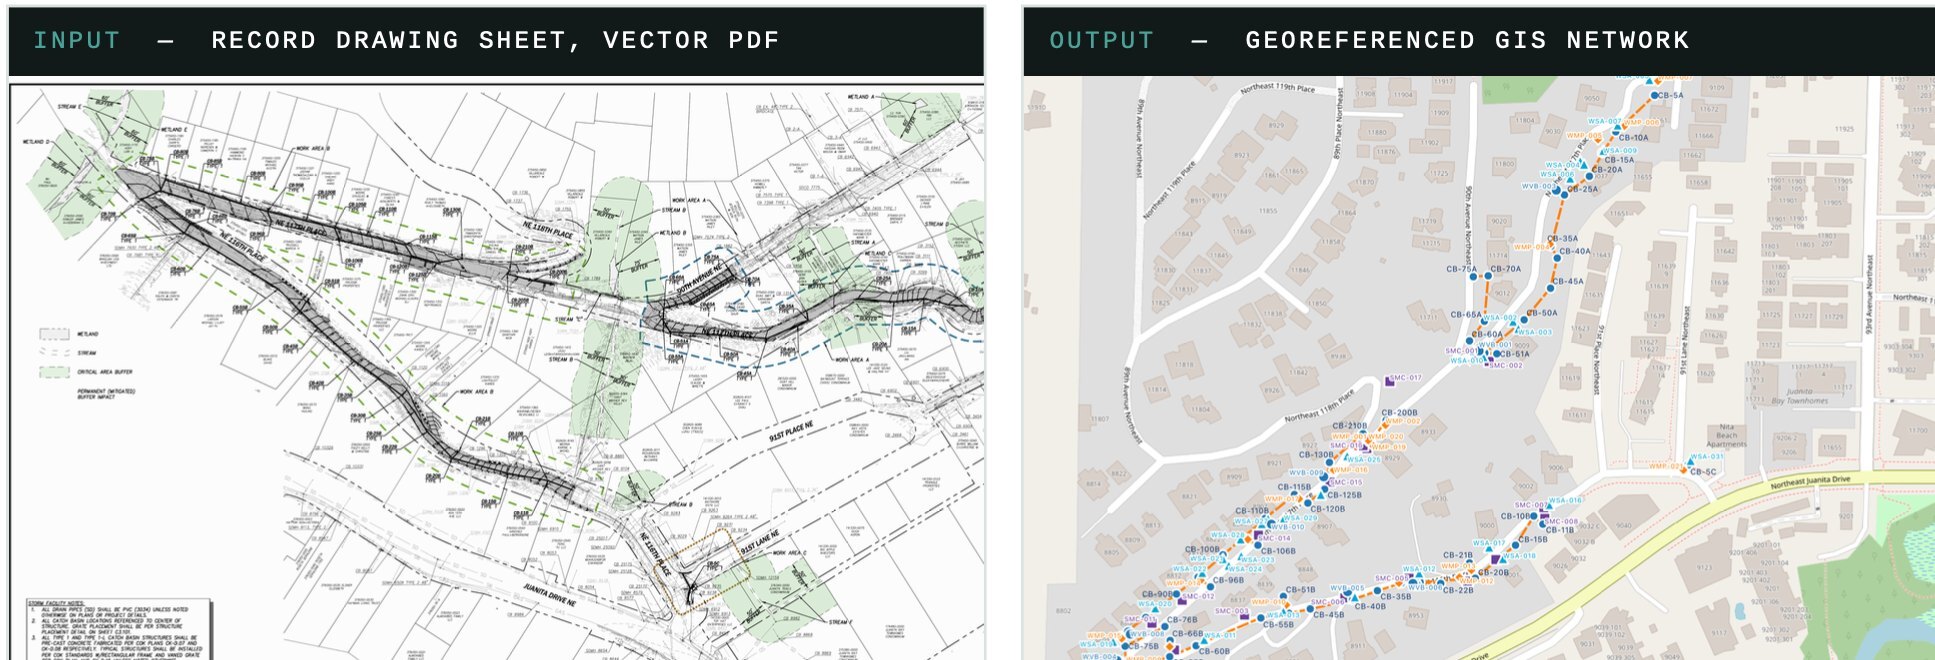
As-Built Digitization
Scanned as-builts, mylars, vector PDFs and CAD become georeferenced, connected, attributed GIS data in hours, not months. Human-verified, with a QA report on every delivery, and ready to feed Leak Zones and risk scoring.
Which solution fits?
| Your question | Solution | What you get |
|---|---|---|
| Where are we losing water right now? | Leak Zones | Priority areas map and ranked pipes, 1–4× a year |
| Which pipes are most likely to break? | Likelihood of Failure | Probability (%) at 1, 2, 3 and 5 years |
| What happens, in dollars, when they do? | Cost of Failure | $ per segment, direct + indirect |
| Where should the next capital dollar go? | Total Risk | $ at risk per segment, ranked for the CIP |
| Our network still lives in drawings. | As-Built Digitization | GIS-ready, Utility Network ready layers |
Send us what you have. In a 30-minute data review we will tell you which solution fits and what your records can support.
Live webinar · Tue, Dec 8 · 9:00 AM PT / 12:00 PM ET
How West Slope Water District uses Fracta AI to act like a larger utility.
Save my seat