


Predict where your water mains are most likely to fail—before they do.
Likelihood of Failure (LOF)
-
Who It's For
Utility managers, asset management teams, and consulting engineers who are responsible for maintaining distribution networks, reducing non-revenue water loss, and prioritizing limited capital budgets.
LOF gives decision-makers the insight to move from reactive to predictive maintenance—knowing which pipes are most likely to fail, when, and why—so they can plan replacements with confidence instead of urgency.
-
What It Is
The Likelihood of Failure (LOF) model is a data-driven measure that estimates the statistical probability a pipe will fail within a given time horizon—typically one, three, or five years.
Fracta’s LOF models use machine learning (ML) and artificial intelligence (AI) to analyze your existing asset data along with over 120+ environmental and geographic variables, including soil composition, elevation, weather patterns, and nearby infrastructure.
The result: a continuously improving, GIS-based prediction that highlights which mains are at greatest risk of failure—so you can target inspection, maintenance, and replacement where it matters most
-
Why Utilities Use It
Reduce Costly Breaks
Every main break costs time, money, and public trust. With LOF, utilities can identify and address vulnerable mains before they fail—reducing emergency repairs, service disruptions, and reputational risk.
Utilities using Fracta’s models have achieved significantly greater accuracy than age-based approaches, fewer annual breaks, and measurable capital savings by targeting only the pipes that truly need replacement.Prioritize with Confidence
LOF gives utilities a defensible, data-driven foundation for asset planning. Instead of relying on age or limited break history, teams can prioritize renewals based on the actual likelihood of failure—optimizing budgets and ensuring that limited funding is directed where it delivers the greatest value to the system and the community.
Empower Smarter Asset Management
LOF integrates seamlessly with every major GIS platform, making it easy for engineers, planners, and managers to visualize network risk and coordinate decisions in one place. From the field to the boardroom, everyone operates from the same clear, data-backed view of system health—no guesswork, no wasted effort.
-
How It Works
1. Data Collection
Your existing data is the foundation. Fracta ingests:
GIS layers including pipe material, diameter, and installation year
Break history records
Operating and environmental data
Third-party datasets such as soil corrosivity, climate information, and proximity to rail lines.
2. Machine Learning Model Training
Our ML models are trained on thousands of miles of historical utility data. Roughly 70–80% of your data is used to train the model, and the remaining 20–30% validates accuracy through a process called time-shifted testing—predicting past events the model has never seen.
This ensures a transparent, defensible accuracy score known as Balanced Accuracy, which measures both true positives (pipes that failed) and true negatives (pipes that didn’t).3. Prediction Generation
The model calculates a probability score for every pipe segment—a percentage representing its likelihood to fail within a given time period.
These predictions are visualized in your GIS as color-coded risk layers, allowing planners to instantly identify “hot spots” for proactive maintenance.4. Continuous Learning
As your utility records new breaks or replacements, Fracta’s models learn and recalibrate—improving accuracy over time. This feedback loop transforms LOF from a one-time analysis into a living, adaptive risk tool.
Likelihood of Failure Models

Absolute Value
Absolute Value represents the pure, model-derived probability that a specific pipe segment will fail — expressed as a percentage between 0 and 100. Unlike relative scores or ranked indices, the absolute value quantifies risk on an objective scale grounded in real-world data.
Fracta’s machine learning engine analyzes hundreds of variables and assigns each pipe its own probability of failure. This absolute probability helps utilities understand not just which mains are riskier than others, but how much more likely one is to fail compared to another.
For engineers and planners, Absolute Value provides the statistical backbone for every decision — a precise, explainable measure of system vulnerability that translates complex AI modeling into a single, actionable number. It enables defensible prioritization, data-driven maintenance, and transparent communication of risk across technical and financial teams.
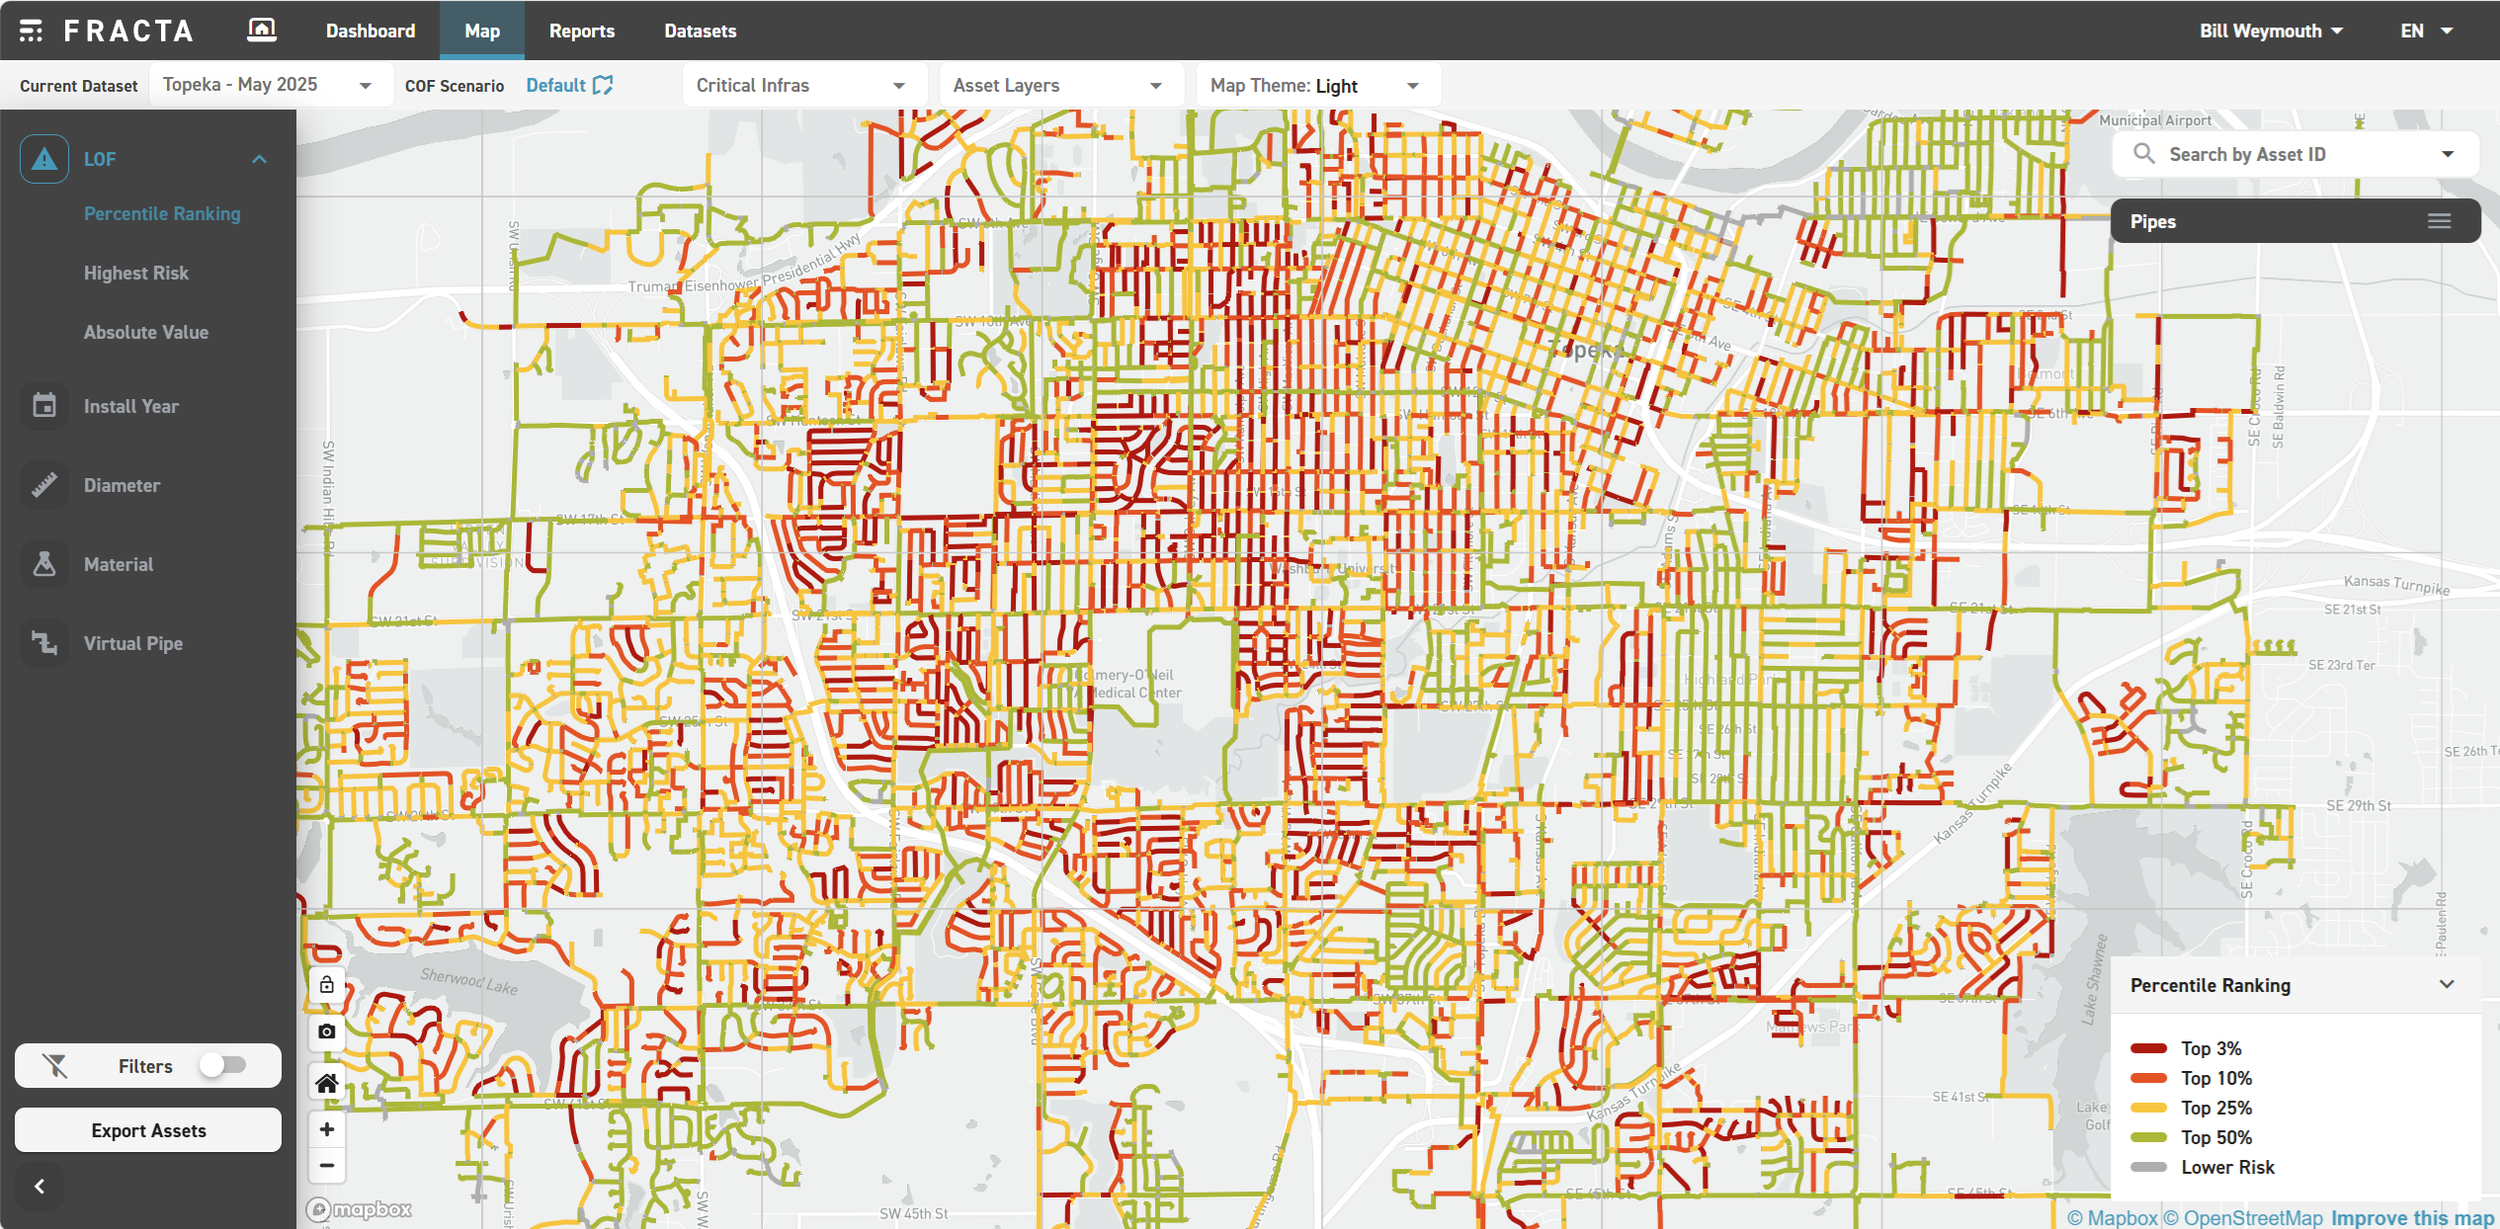
Percentile Ranking
Percentile Ranking shows where each pipe stands in relation to all others in the network, ranking its probability of failure on a scale from 0 to 100. Rather than expressing the absolute likelihood of failure, the percentile ranking answers a different but equally important question: How risky is this pipe compared to the rest of the system?
By sorting every segment’s predicted LOF value and placing it within the overall distribution, Fracta’s model provides utilities with an intuitive, system-wide view of relative risk. A pipe in the 5th percentile, for example, has a higher probability of failure than 95% of the other pipes in the system.
This ranking helps utilities quickly pinpoint the riskiest areas and focus capital planning, inspection, or condition assessment resources where they’ll have the greatest impact. It also provides a defensible, data-driven framework for communicating priorities to boards, regulators, and the public—bridging the gap between complex AI predictions and clear, actionable decision-making.

Highest Risk
Highest Risk view highlights the specific pipe segments that the model predicts are most likely to fail within the defined analysis period — typically the top 1–5% of all segments based on their Likelihood of Failure scores.
These are the pipes where multiple contributing factors converge — age, material, soil corrosivity, elevation, historical break patterns, and environmental stressors — creating a statistically elevated probability of failure. By isolating this subset, utilities gain an immediate, actionable picture of where the network is most vulnerable.
For utility managers and engineers, the Highest Risk feature serves as both an early warning system and a planning compass. It enables proactive inspection, targeted replacement, and budget allocation focused precisely where risk is greatest. Rather than treating every mile of main equally, utilities can concentrate effort and funding where it will deliver the most meaningful reduction in break frequency and service disruption.
LOF Filters
The Filters feature gives users complete control over how they view and interpret their system’s risk data. With intuitive filtering options for installation year, material, diameter, and other asset attributes, utilities can instantly isolate the parts of their network that matter most.
Whether you’re evaluating older cast iron mains, comparing PVC performance by decade, or reviewing specific pipe sizes within a pressure zone, LOF Filters make it easy to focus on the details that drive real decisions. Each filter dynamically recalculates the distribution of Likelihood of Failure values, revealing trends and outliers that might otherwise remain hidden.
This capability turns Fracta’s LOF results into a flexible analysis tool — one that adapts to your questions, your data, and your priorities. Instead of scrolling through static tables or maps, engineers and managers can zero in on exactly the segment of the system they need to understand, making every planning meeting, capital decision, and inspection program more targeted and efficient.